In August 2024, the Park City vacation rental market experienced mixed performance. Occupancy rates slightly increased, but overall demand softened compared to the peak summer months. With families returning home for the school year, occupancy dropped from July levels. However, key metrics such as the average daily rate (ADR) and revenue per available room (RevPAR) showed year-over-year growth. These trends highlight the resilience of the Park City vacation rental market despite seasonal fluctuations.
Date Range: 8/1/2024 – 8/31/2024
Key Takeaways
Seasonal Trend:
- August brought some respite to a dry Park City summer with seasonal monsoonal rains, which kept temperatures within their average range. As a result, we didn’t see as many people looking to Park City for cooler temperatures.
- Occupancy demand in August drops compared to July due to kids returning to school.
Market Insights:
- August 2024 saw an 18.79% decrease in occupancy over July 2024.
- The increase in year-over-year (YoY) ADR was the second time this year.
- RevPAR saw its second YoY increase in five months.
Overview
In August 2024, the Park City vacation rental market experienced a slight uptick in occupancy compared to the same period in 2023, with an occupancy rate of 26.8%, up from 26.1%. Average daily rates (ADR) also significantly increased, rising by 5.98% to $195, compared to $184 in August 2023. Revenue per available room (RevPAR) continued its upward trend by 8.33% to $52, marking the second year-over-year increase in five months. This was despite a general decrease in demand following the peak of summer as families prepared for the return to school.
Detailed Metrics
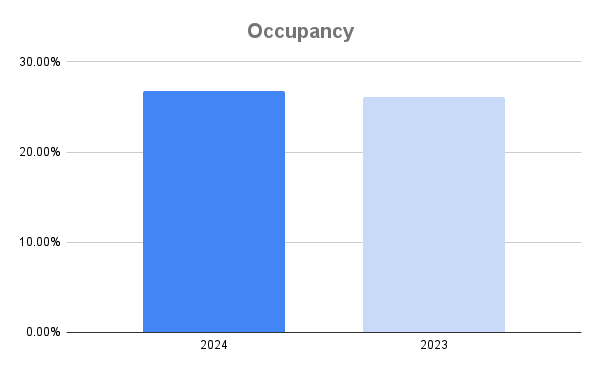
Occupancy:
In August 2024, Park City saw a slight increase in occupancy, rising to 26.8% from 26.1% in 2023, reflecting a 2.68% year-over-year growth.
- 2024: 26.8%
- 2023: 26.1%
- An increase of 2.68%
Average Daily Rate (ADR):
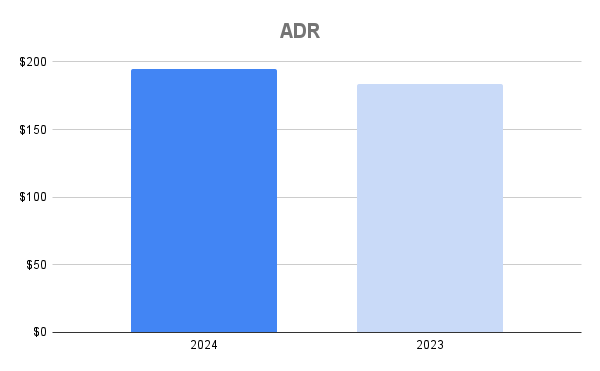
In August 2024, the average daily rate (ADR) in Park City increased by 5.98% year-over-year, rising from $184 in 2023 to $195 in 2024.
- 2024: $195
- 2023: $184
- An increase of 5.98%
Revenue Per Available Room (RevPAR):
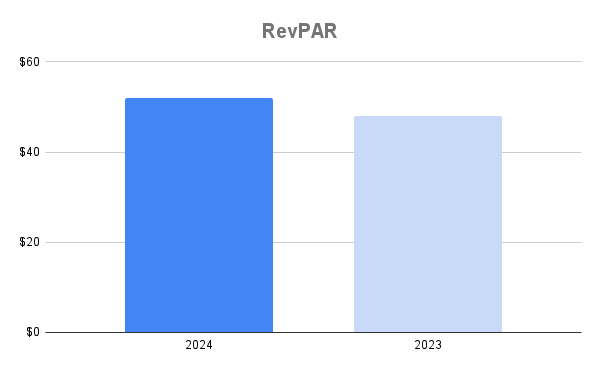
Park City’s RevPAR saw a notable year-over-year improvement in August 2024, growing by 8.33% from $48 in 2023 to $52.
- 2024: $52
- 2023: $48
- An increase of 8.33%
Conclusion
Although the end of summer led to a seasonal decline in occupancy, the August 2024 Park City vacation rental market showed resilience with steady growth in ADR and RevPAR. Occupancy increased compared to 2023, and despite the slower season, property managers could command higher rates. These trends suggest that Park City’s vacation rental market remains strong, even during traditionally quieter months.
Compare this to the July 2024 vacation rental performance.
Dataset
The data set encompasses information from Key Data, with 60 property managers overseeing 3,200 properties of various sizes, ranging from 0, 1, 2, 3, and 4 bedroom units. Key neighborhoods covered in the report include Bear Hollow, Canyons Village, Deer Valley, Jordanelle, Kimball Junction, Old Town, Prospector, and Thaynes Canyon. This comprehensive data provides valuable insights into occupancy rates, average daily rates, and revenue per available room across these regions.

![Your Guide To Park City Mountain Lift Tickets [2024-2025] Your Guide To Park City Mountain Lift Tickets [2024-2025]](https://www.allseasonsresortlodging.com/wp-content/uploads/2023/09/ski-slope-from-lift_1024x1440-1.jpg)
