Q1 2026 Results
Why Our Owners Earned More Than the Park City Market in a Historically Tough Winter
A transparent look at how All Seasons-managed properties performed against the broader Park City rental market through the lowest-snow ski season on record.
The Winter That Wasn’t
The 2025–26 ski season will be remembered as one of the most challenging winters in Park City’s modern history. Park City Mountain recorded just 158 inches of snow against its 355-inch average, and Utah logged its worst statewide snowpack since measurements began in 1930 — a snow water equivalent that came in at one-fifth of the previous record low.
The lodging market felt it immediately. Per the Park City Chamber & Visitors Bureau, March 2026 lodging occupancy fell to 52.3%, down 24.4% year-over-year. Both Park City Mountain and Deer Valley closed roughly three weeks earlier than planned.
Every property manager and rental owner in Park City felt some version of this story. The question worth asking isn’t whether your property earned less than last year — it almost certainly did. The question is how your property performed relative to the market.
All Seasons Owners Out-Earned the Market
All Seasons-managed properties earned 19.9% to 46.2% more per available night than the broader Park City rental market.
Adjusted RevPAR, January 1 – March 31, 2026. Source: Key Data benchmark.

Canyons Village Area
The market averaged $184 in adjusted RevPAR per night across Q1 2026. All Seasons-managed properties at Canyons averaged $269 — a per-night premium of $85, or 46.2% more than the market average.
Old Town and Park City Base Area
The market averaged $267 per night. All Seasons-managed properties averaged $320 — a per-night premium of $53, or 19.9% more than the market average.
Over a 90-day quarter, those gaps translate to roughly $4,770 to $7,650 in additional revenue per unit compared to an average market competitor.
A note on methodology: these are adjusted RevPAR figures from the Key Data benchmark, which controls for property type and bedroom count — an apples-to-apples comparison.
The Gap Held Every Week
Outperformance like this didn’t come from one or two big weeks. Our owners earned more than the market every single week of the quarter, in both submarkets.
Canyons Village — Weekly Trend
7-day rolling average RevPAR, weeks 1–13 of Q1 2026.

Old Town and Park City Base — Weekly Trend
7-day rolling average RevPAR, weeks 1–13 of Q1 2026.

How We Get There
There’s no single secret. There’s a stack of small things, done every day, that compound across a quarter:
Dynamic, Demand-Aware Pricing
Park City’s demand windows are narrow and intense. Our revenue team adjusts pricing daily based on booking pace, competitor rates, and search volume.
Direct-Booking Strength
Our True-Blue repeat-guest program, Lowest Rate Guarantee, and direct marketing investment mean a meaningful share of bookings bypass 15–18% OTA commissions. More of every dollar lands in owner accounts.
Property Presentation That Earns the Click
Professional photography, accurate listings, and detailed amenity tagging put our properties in front of guests who are actually a fit.
A Local Team Since 1999
Park City is a market where institutional knowledge matters. We know the buildings, the HOAs, the rental restrictions, the maintenance vendors, and the booking patterns.
See How Your Property Compares to the Market
Free, no-obligation property income comparison for Park City homeowners. Share a few details about your property and we’ll send back a one-page analysis showing what your property likely earned this winter versus a comparable ASRL-managed property. No pitch, no follow-up unless you ask for it.
Sources and context: Adjusted RevPAR comparisons: Key Data benchmark, Q1 2026. Snow and season context: Park Record, KPCW, SnowBrains (March–April 2026). Lodging market data: TownLift, KPCW, and the Park City Chamber & Visitors Bureau (April 2026).


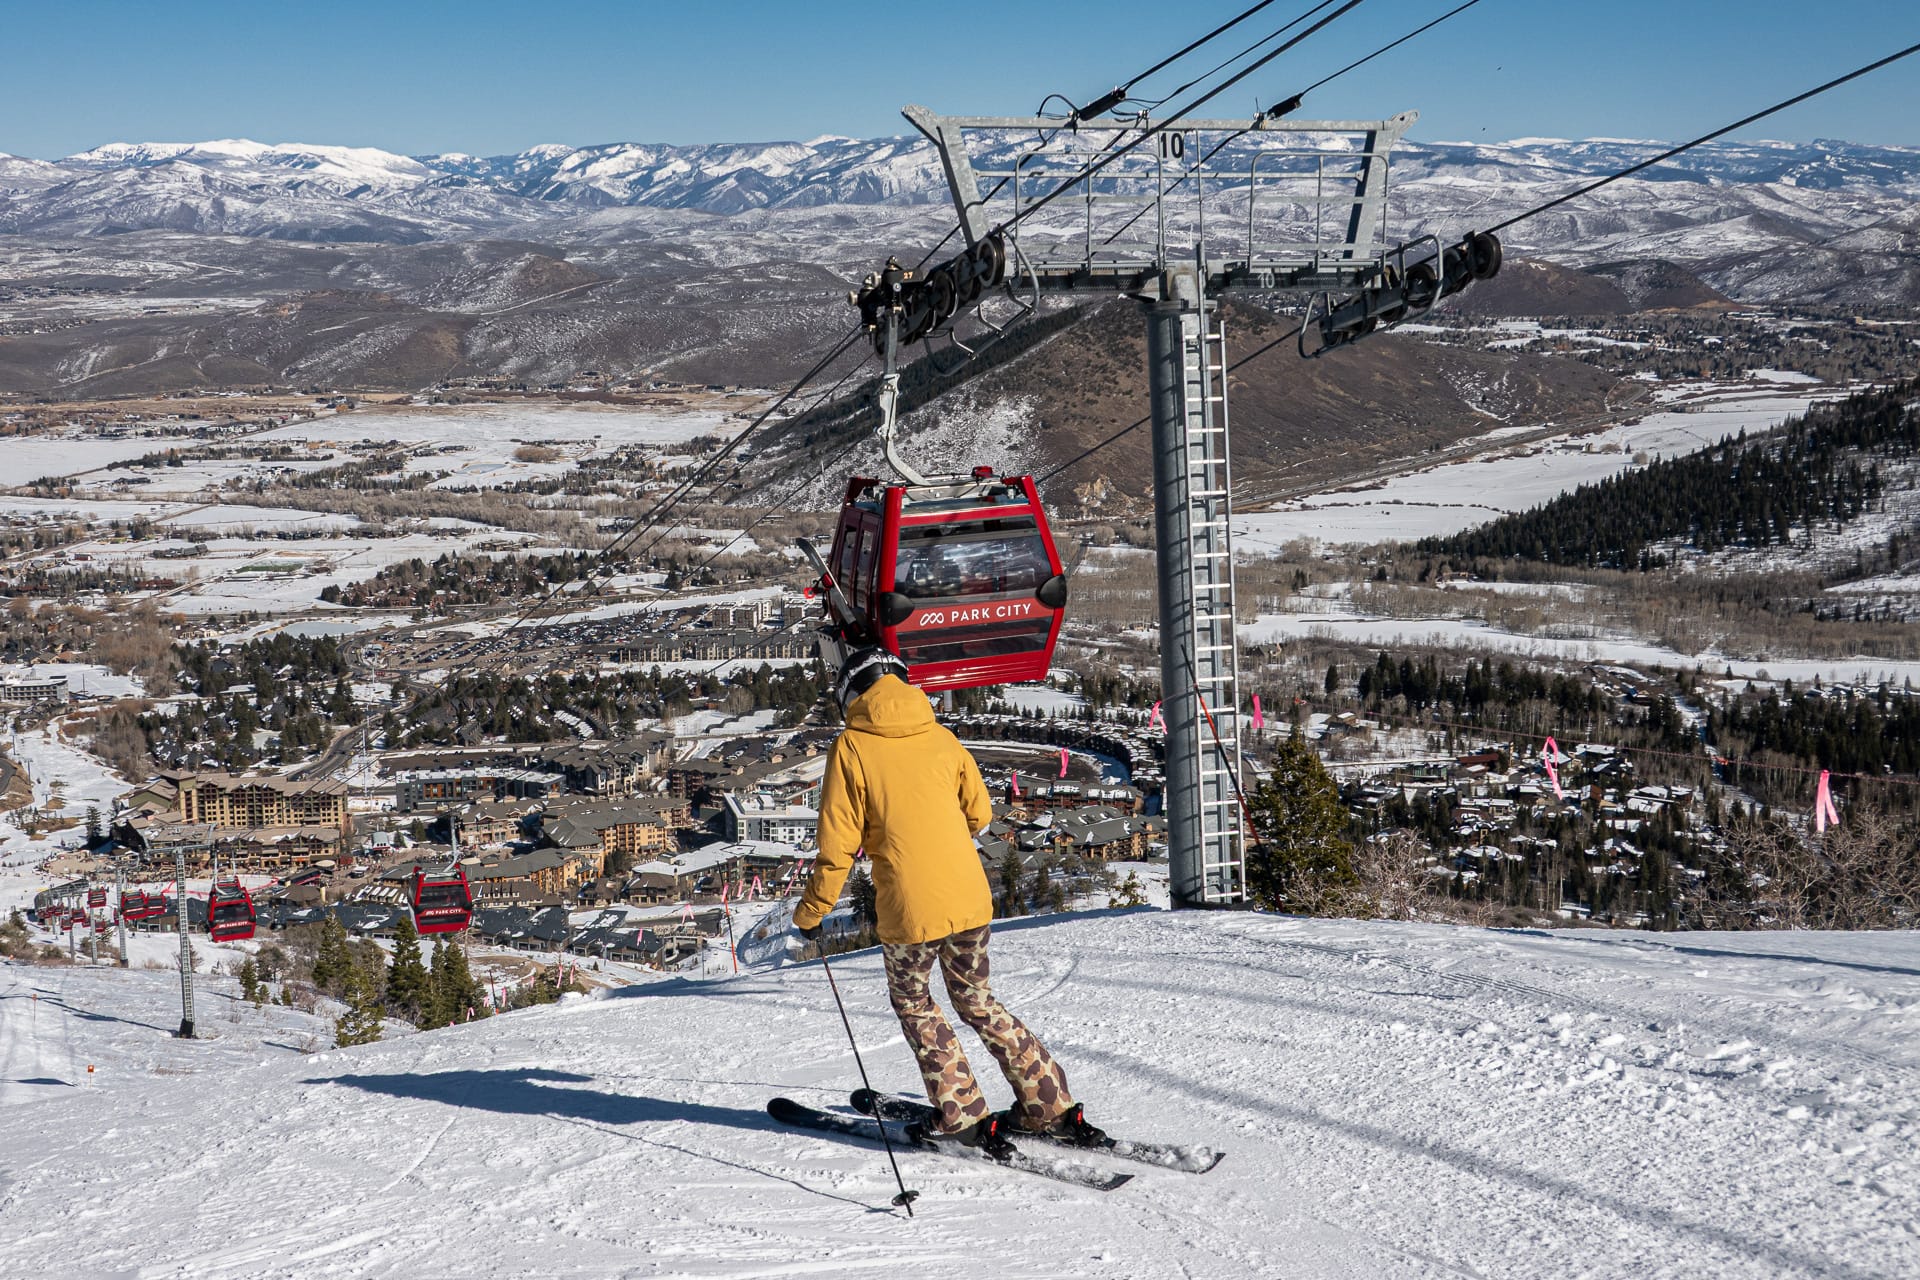
![Your Guide To Park City Mountain Lift Tickets [2024-2025]](https://www.allseasonsresortlodging.com/wp-content/uploads/2023/09/ski-slope-from-lift_1024x1440-1.jpg "Your Guide To Park City Mountain Lift Tickets [2024-2025]")