San Diego performance update · Q1 2026
Our San Diego owners earned 58.9% more than the broader market in Q1. Q2 is pacing even further ahead.
A transparent look at how All Seasons-managed properties in San Diego performed against the broader market in Q1 2026, with the on-the-books read on the balance of the year.
What that meant in real owner dollars
Percent variance is the cleanest way to compare your property to the market, because it controls for the absolute rate. But percent variance is not what reaches your account. Real dollars are.
Across the 90 days of Q1, the +58.9% premium our portfolio earned translated to roughly $6,863 in additional revenue per unit, vs. a comparable competitor of the same property type and bedroom count.
The full quarter, week by week
Our portfolio (navy line) sits above the broader San Diego market (gray line) across every two-week period in the quarter. The blue shaded gap is where our owners earned more than the market. The gold band on the right is the on-the-books pace for the balance of the year.
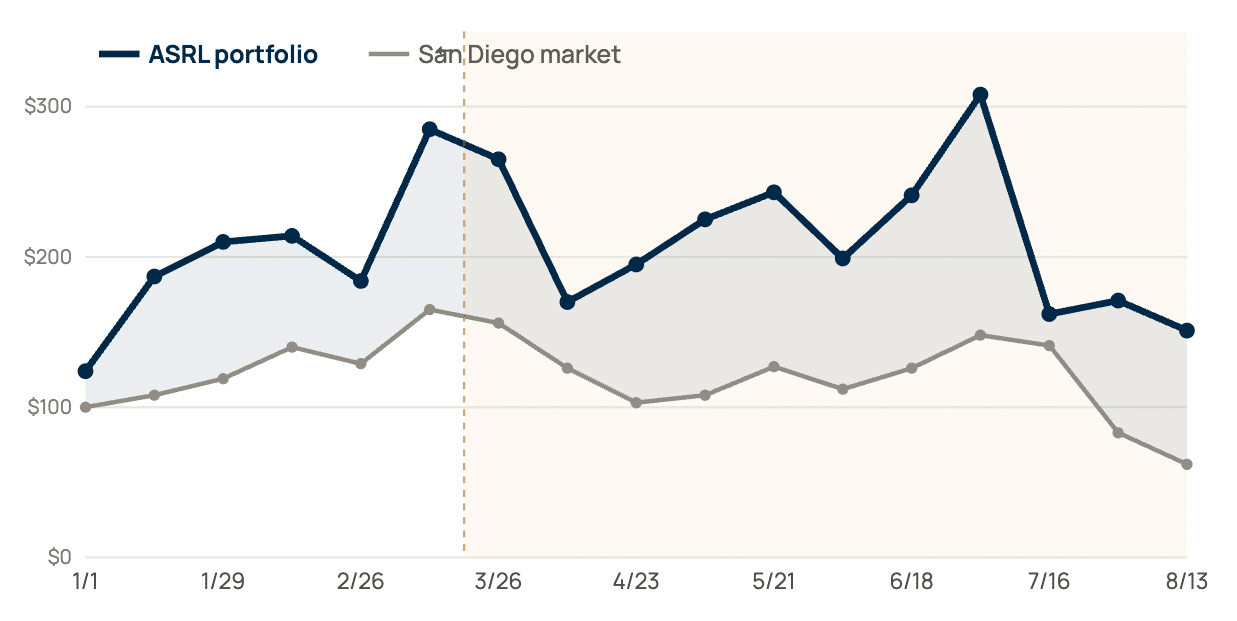
Adjusted RevPAR by two-week period. Source: Key Data benchmark, as of May 21, 2026.
The peak that mattered most
The single strongest pricing window of the quarter was the mid-March spring-break stretch. Across the portfolio we earned 73% more per night than the broader San Diego market for that two-week window. The premium did not happen on the night the rate was set. It happened 60 days in advance, when the booking pace inside the window was already lifting and the listings still had inventory worth holding.
What’s already on the books for the balance of 2026
Our Q2 pacing is currently running about 80% above the San Diego market on adjusted RevPAR. The lead-in to summer is filling up.
Pacing reads will continue to move as bookings come in. Comic-Con (July 23-26) is the next major window we’re actively pricing.
What drives the premium
There is no single secret. There is a stack of small things, done every day, that compound across a quarter. Three habits did most of the work this winter and continue into the summer.
A third lever, direct booking, returns the 15-18% OTA commission to owners on roughly one in three of our reservations.
What this means for you
The right question to ask any vacation rental property manager is not “what did my property earn last quarter.” Your statement tells you that already. The right question is “how did my property earn relative to the broader San Diego market.” That number is the comparable, and it is the one your statement almost certainly does not show you on its own. We’d like to run yours.
What This Means for Our Owners
The gap between our owners and the broader market doesn’t happen by accident. It’s the result of an active, multi-channel marketing engine: properties that surface in front of high-intent travelers, pricing that responds to demand in real time, and a repeat-guest program that brings travelers back.
See How Your Property Compares to the Market
Free, no-obligation property income comparison for Park City homeowners. Share a few details about your property and we send back a one-page analysis showing how your property has been performing against the market.


![Your Guide To Park City Mountain Lift Tickets [2024-2025]](https://www.allseasonsresortlodging.com/wp-content/uploads/2023/09/ski-slope-from-lift_1024x1440-1.jpg "Your Guide To Park City Mountain Lift Tickets [2024-2025]")